Understanding Glasgow turns ten!
18 January 2021
The Understanding Glasgow website, launched in January 2011, set out to create and present, in an accessible and engaging way, a set of health and wellbeing indicators for the city.Its aim was to improve understanding of health and its determinants in Glasgow and to be a tool whereby inequality could be highlighted and monitored, and progress measured.
Led by Glasgow Centre for Population Health, the indicators and website were the product of a collaboration among the city’s main public agencies, pulling together information from many sources. The partners involved in developing the website included Glasgow City Council, Glasgow Community Planning, Community Safety Glasgow, Glasgow Life, NHS Greater Glasgow and Clyde, the University of Glasgow and the International Futures Forum.
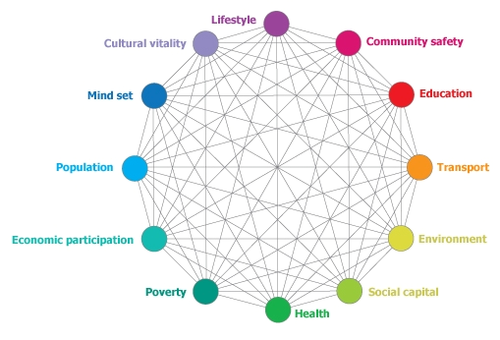
The data is centred on 12 key domains, representing a dynamic interlinked view of different aspects of health and life in the city. These domains are: lifestyle; community safety; education; transport; environment; social capital; health; poverty; economic participation; population; mindset; and cultural vitality.
The site contains in excess of 190 indicators across these 12 domains and a further seven domains focused on children’s health and wellbeing. These are presented via graphs and maps, which illustrate trends and comparisons, and have accompanying interpretation.
Growing the site and adding resources
Other resources have been added over the last decade, including case studies of community projects using assets-based approaches, a series of short films about life in Glasgow and a section on using the data in educational and policy settings, which includes examples of Glasgow Game events.
Health and wellbeing profiles have also been added. These cover 60 different areas in total; Glasgow as a whole, three sub-sectors within Glasgow (North East, North West and South Glasgow) and 56 neighbourhoods across the city. These are designed to provide an easily accessible summary of health and wellbeing in different communities within Glasgow.
The profiles highlight differences in health and life circumstances across the city and are provided via online web pages, interactive maps, PDF summaries and within an Excel workbook.
Building on the children and young people’s profiles, the newest addition to the resources are Children’s Report Cards, published in February 2020. Focused on the environment; income inequality and poverty; demographic trends; 21st century issues (including social media); and healthy diet and weight, these present public health information on children and young people’s health and wellbeing.
We are very grateful for the ongoing commitment of partners in developing the website, ensuring the information is updated regularly and helping to make it the well-used resource it has become. We have been delighted by the increasing visitor numbers and feedback received over the years, which have demonstrated the accessibility of the data, its wide appeal and uses. We hope it will continue to be a much visited and used resource across the city for at least the next decade!
If you haven’t visited the website in a while please do so as the data is updated regularly, or if you haven’t used it before, why not take a look?
Visit the Understanding Glasgow website.
Watch a short animation about Understanding Glasgow.
Feedback
Many thanks to those who have used the website and provided helpful feedback to us. We’re always happy to receive feedback – good and bad, on how you’ve used it, or ideas for improvement – so please do send any comments you may have to Sheena Fletcher.
“As a Modern Studies teacher, Understanding Glasgow has become an essential part of my courses. Higher Modern Studies students find it straightforward to access the statistics and analysis which is vital to their wider understanding of inequality and the infographics highlight the key issues we study. Advanced Higher students rely on the statistics to support their own research for dissertations and we use the infographics to discuss the use of different methods of presenting research findings. Understanding Glasgow has been a fantastic resource to use in the classroom.”
Modern Studies Teacher, Glasgow
“Congratulations on accomplishing such an accessible, informed, and inviting portal into the universe of Glasgow life. Even a few minutes of banging around in it brought forth empathy, concern with where things seem to stand and a creative juice or two.”
Participant from launch workshop, 2011
“What a fantastic tool for anyone interested in Glasgow and cities anywhere.”
“A one stop shop for information from across the main partners of the city”
“A research resource for papers, presentations, evaluations and funding applications”
Feedback from online users